


To identify these opportunities, we go through 4 stages: we decide on Typology, filter out sites that do not fit our purpose or with high risks, then sort development opportunities from the best to the worst, and, finally, add property market data for each site.
Subsidiary Dwelling Unit development is a popular model for many property owners in CoJ. The latest town planning regulation allows an owner of a property zoned Residential 1 to build up to two subsidiary dwelling units on the said property. Of course, subject to additional conditions, it is an opportunity for small-scale developers which simultaneously stimulates the densification and diversification of low-density residential areas.
The floor area of the subsidiary dwelling units cannot exceed 160m² or 90% of the main dwelling house. The overall development should also comply with the density and the site coverage criteria attributed to the area. These units may only be built in relation to an existing dwelling. By following these guidelines, property owners can expand a home or create an additional rental unit while staying within the parameters set by planning rules.
Despite these guidelines and the corresponding CoJ Land Use Scheme 2018, Johannesburg faces a lot of pressure from property developers to build on the urban periphery. Township establishments and re-zoning on the periphery feed urban sprawl and transport mobility problems.
By looking deeper into the attributes of the sites, we found that overlapping plots have different subdivision statuses – either a Registered Stand, SG Approved Stand or Proclaimed Township.
Registered Stands are the plots that are registered in the Deeds Office and have information on zone restrictions (e.g. height, density, coverage, etc.) SG Approved Stands and Proclaimed Townships are the ones not registered in the Deeds Office. To consider these, one needs to find out from the Deeds Office why the property is not registered. There are usually multiple reasons.
To be sure that one will not have problems with future development, we decided to consider Registered Stands only, meaning those registered in the Deeds Office - the main organisation that manages property rights
- Compactness shows how far a land plot deviates from the most efficient shape - a circle. It calculates the ratio of a circumference of the equivalent circle to an actual perimeter of a land parcel.
- Regularity shows how close it is to a perfect rectangle. It calculates the ratio of the smallest possible bounding rectangle area (green boundary in Fig. 4) with a parcel area (black boundary in Fig. 4).
The GeoLIS dataset provides great accuracy but has these limitations:
- Coverage. The dataset covers 24% of the CoJ including Randburg, Roodepoort, Sandton, Midrand, Baralink, and Jabulani and several priority zones (i.e. CBD and area along railway and BRT routes).
- Validity. The dataset is dated back to 2012. Therefore any development built after that is not recorded.
However, we advise seeking more precise information (e.g. zoning certificate and on-site survey) on any particular property or site prior to making any decisions. Please refer to our Disclaimer.
Even though Gauteng is the smallest province in South Africa by land area, it is one of the two largest property markets (along with the Western Cape). More than 3,000 detached single-family houses were built here in 2021 alone, making this market segment larger than flats and townhouses by value.
We have evaluated more than 200 single-family development projects in Johannesburg and Pretoria to identify the most sought-after housing typology.
The results provide a wide range of development opportunities varying in parcel dimensions, floor size, and the number of bedrooms. The typologies we have identified are: S – Small, M – Medium, L - Large, and SDU – Subsidiary Dwelling Unit ⓘ.
Conversely, mixed-use areas with diverse housing typologies and densities, balanced with public transport infrastructure and services, create more advantageous environments.
In this OneCity Insights, we use additional tools to the planning regulations to identify investment opportunities in locations that are favourable for the city and sought-after by leading investors.
| Risks & Constraints | Details | Importance Verdict |
|---|---|---|
| Parking | What is that?The Land Use Scheme and Spatial Development Framework (SDF) establish a requirement for a number of on-site parking bays of at least 30m2 each. There are three well-defined areas in the city with different requirements: Inner City, areas around public transport stations and Nodes as per the SDF, and the Rest of the City. The Rest of the City has the lowest requirements for the number of bays required.Source: Land Use Scheme 2018 (Part 6) and Spatial Development Framework How important is it for us?As we are focused on single-family detached houses built on sites of more than 250m2, the requirement is of very low importance. The maximum parking space required for a typology L would be two parking bays or 60m2. | 1 |
| Building restriction area | What is that?Building restriction areas establish the minimum distance from building boundaries to the street. The distance depends on the size of the site and equals 1 meter for sites less than 500m2 and 3 metres for larger sites.Source: Land Use Scheme 2018 (Part 5)How important is it for us?The minimum distance in metres between the building’s line and street boundary could be an additional restriction for new buildings in the dense environment of a city centre. However, for single-family houses, this restriction has a very low impact. Additionally, this restriction does not vary across the city and depends only on the size of the plot. For this reason, this constraint does not apply. | 0 |
| Wetland Audit | What is that?These are the areas that can be affected by marshes or swamps - sensitive ecosystems and difficult soils to build on.Source: The CoJ wetland audit layers are based on: National Spatial Development Framework, Integrated Development Plan (CoJ), Biodiversity Plan and National Environmental Management Act (NEMA), and Gauteng Provincial Environmental Management Framework.How important is it for us?Planning decisions in these areas need to be supported by an environmental survey and impact assessment. This could significantly affect the design of the building and, for this reason, has a medium impact on the development. | 3 |
| Dolomitic areas | What is that?These are the areas in CoJ with underlying dolomitic limestone rocks. These areas have additional soil/ dolomite stability risk.Source: Land Use Scheme 2018 (Section 14)How important is it for us?To get building permission in these areas, one needs to conduct a geotechnical survey which usually requires one to own the site (or have a permit from the owner). Additionally, due to ground conditions, these areas impose additional requirements for foundations and on-site infrastructure. For these reasons, these conditions have a medium impact on the choice of the site. | 3 |
| High control zones | What is that?These environments are sensitive to development activities. Source: Gauteng Provincial Environmental Management Framework How important is it for us?Only conservation should be allowed in this zone. Related tourism and recreation activities must be accommodated in areas surrounding this zone. For this reason, sites within these areas are excluded. | 5 |
| Environmental Control Areas | What is that?An Environmental Control Area is an area defined by the Municipality within which any development is subject to a list of supporting documents and impact studies. Primary uses are public and private open spaces. Consent Uses are Tourist Facilities, Holiday Accommodation, and Transmission Towers.Source: Land Use Scheme 2018 and National Environmental Management: Protected Areas Act 57 How important is it for us?Documents required: Site Development PlanEnvironmental Management PlanVisual Impact Assessment Overall this has a high impact on the development potential | 4 |
| Servitude Line | What is that?Servitudes are essentially areas of limited rights to use part of the land or the whole site. They could be rights of way to get to another site or maintain a piece of infrastructure (e.g. water pipe).Source: GEO LISHow important is it for us?As the servitude gives a right to its holder to do something with the other person's property or its part, it has a very high impact. However, servitudes usually cover only a small part of the site. For this reason, we exclude from our analysis only the sites where servitudes cover more than 30% of the site area. | 5 |
| Ecological Resource Zone | What is that?Ecological Resource Zones are areas beyond the Urban Development Boundary. Development there is not encouraged and is possible only through a Township Establishment procedure. Source: Spatial Development Framework 2016 (section 7.5), Nodal Review 2019 (section 4.1)How important is it for us?As residential development is discouraged in this zone, the sites in these areas are excluded. | 5 |
| Disaster Management plan | What is that?The policy focuses on preventing or reducing the risk of disasters. The Disaster Management Act prescribes the development of disaster management plans at national, provincial and municipal scales. For example wetlands can contribute to flooding mitigation and water quality improvement. When building on wetlands the risk of buffering should be mitigated and demonstrated in the disaster management plans.Source: Disaster Management ActHow important is it for us?The Disaster Management Centre will require the following documents or confirmation that the following concerns have been addressed before any development is finalised: Geotechnical surveyHydrological surveyStormwater assessmentEnvironmental impact studyThere is a high impact on new development because of the time-consuming confirmation process. | 4 |
| C-Plan(Protected Areas, Critical Biodiversity Areas, Ecological Support Areas) | What is that?These are areas identified by the Gauteng Conservation Plan Version as critical for maintaining biodiversity and must be integrated into land use planning and decision-making with considerations.Source: Gauteng Conservation PlanHow important is it for us?Detailed environmental impact studies are required for all development applications within these areas. For this reason, it has a medium impact on site choice. | 4 |
| Flood Risk Zones | What is that?These are areas prone to flood risk once in 50 or 100 years. No development is permitted in these zones, as well as river riparians and a buffer of 30 metres around them.Source: Land Use Scheme 2018 (section 49)How important is it for us?As no development is permitted in these zones, sites falling within their boundaries are excluded. | 5 |
| Incentive | Details | Importance Verdict |
|---|---|---|
| Urban development zone | What is that? The urban development zone (UDZ) is one of the most important fiscal and planning tools in South Africa to stimulate the renewal process in declining areas. Depending on the zone it could have tax allowances for investments made into the refurbishment of existing property or new development, relaxed zoning requirements and more. Source: Urban Development Zone How important is it for us? UDZ in the City of Johannesburg applies to the inner city. This area is characterised by high density, transport accessibility and commercial uses.As we are looking into low-density single-family housing, the importance for us of the UDZ defined in the inner city is very low. | 1 |
| JPC Land Regularisation | What is that? Land Regularisation is a program being delivered by the Joburg Property Company to transfer council-owned properties into the hands of residents. This is intended to optimise the use of the space and budget, and meet the goals of SDF 2040.“Over the next three to five years, the Joburg Property Company (JPC), through its innovative land regularisation programme, will transfer some 3 700 properties across Johannesburg into the hands of local residents.” Source: Land Regularisation Programme How important is it for us? The Property being transferred is mostly for commercial use and therefore is of very low importance to us. | 1 |
| Corridors of Freedom | What is that? Corridors of Freedom were introduced as new public transport routes based on the concept of the Bus Rapid Transport (BRT) system. The initial intention of the project was to link low-income, deprived areas with inner city and economic centres. The project was realised partially and is on hold at the moment. In addition to creating new transport routes, the project offered regulatory incentives for developers, e.g. reduced waiting times for planning approval. Source: How important is it for us? The project is considered highly controversial due to shortcomings in the design and delivery process. However, the system still works for townships and has the capacity to be improved and extended. We consider it as having medium importance at the moment. | 3 |
| Transformation Zone | What is that? The Transformation Zone consists of areas where public investment will be prioritised to improve these areas and make them new growth centres. These are equivalent to Integration Zones, defined in the Built Environment Performance Plan (BEPP). They include The Inner City, Corridors of Freedom, Randburg – OR Tambo Corridor, Mining Belt and Soweto, Metropolitan and Regional Nodes (as per Nodal Review), General Urban Zone and Local Economic Development Zones.” Source: Transformation Zone How important is it for us? The timeline of public investments in Transformation Zones, exact projects, their quality and their delivery are all highly uncertain parameters. Nevertheless, these areas are the focus of government funding for years to come. We consider the importance of this as low. | 1 |
| Consolidation Zone | What is that? Consolidation Zones are mostly low-density residential zones and, in contrast to Transformation Zones, are not a high priority for capital investment - except where there is a backlog of services. Density and development guidelines should be in line with the Nodal Review. Source: Spatial Development Framework 2040 and Nodal Review 2019/20 How important is it for us? Consolidation zones are areas that should not expect large public investments. This is because, in most cases, they have just enough infrastructure to accommodate some new development. Because the infrastructure is already there, we consider these areas of medium importance for our typologies. | 3 |
| Economic Nodes | What is that? Similar to transformation zones - Economic Nodes are areas of prioritised public funding. However, in addition to funding, these zones already have high economic activity and additional potential. Source: Spatial Development Framework 2040 How important is it for us? Because these zones combine plans for public investment and existing economic potential, these areas are of high importance. | 4 |
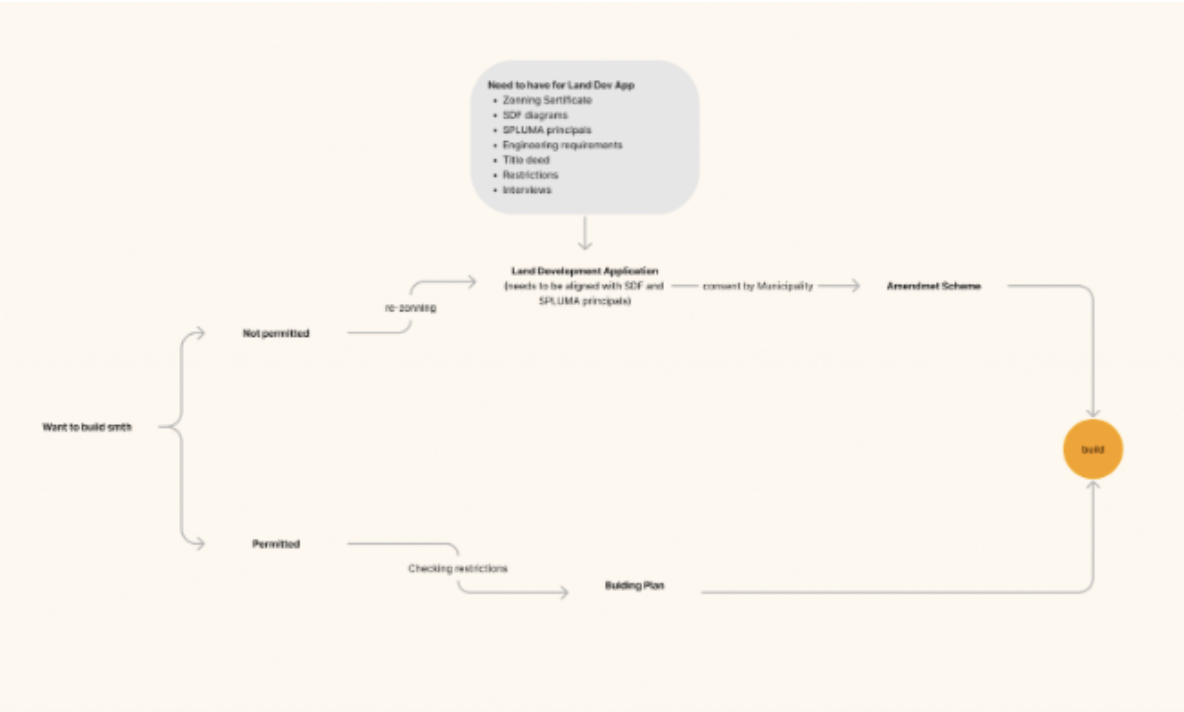
These "Residential" Land Use Rights could be Primary and Secondary and include: dwelling houses, dwelling units and residential buildings. If future development matches Primary Land Use Rights (e.g. you are planning to build a detached house on a land with Primary Land Use Rights that include dwelling houses) the process to obtain the permission is easy. You only need to submit a Building Plan ⓘ making sure it complies with set restrictions for density, height, setback and more.
In contrast, if your future development is permitted only according to Secondary Land Use Rights, you must submit a Land Use Management Application ⓘ and go through the rezoning process. The rezoning process is long and painful and, most importantly, requires the relevant land to be purchased by the applicant beforehand. The later is a substantial barrier for smaller entrepreneurs.
By identifying developable sites that do not require rezoning, we want to unlock development opportunities that are suitable for smaller entrepreneurs, in a market dominated by large developers.
The good news is that residential property is automatically permitted as Primary Land Use Right in 7 Zones: Residential 1-5 and Business 1-2.
By filtering out unregistered sites and keeping only those registered with the Deeds Office, we reduced the number of sites that fit our purpose from 652 974 to exactly 601 479 plots, which is 92% of the original total.

As we are supporting smaller entrepreneurs here, we decided to limit the maximum size of the plot to 2000 m2.
It means that once the internal access roads are built (or setback lines are accounted for) the 2000 m2 could accommodate up to 2 units of the typology L, or up to 6 units of the typology S. By limiting our search to this range we identified 423 093 sites in Joburg (65% of the original total).


By running the above calculations we identified 181 753 sites that have development potential. This figure includes sites with moderate development potential, usually an extension to the existing building’s coverage area of 30-50%. For the sites where the coverage could be increased by more than 50% the development potential is high, this could be a Subsidiary Dwelling Unit on Residential 1 or additional property in other zones. You can find the potential development coverage in square meters for selected sites in any given location in Johannesburg by purchasing OnecCity Insights Report.
Total of residential sites: 181 753, which is 28% of the total.
We analysed Risks & Constraints available in public registers, and explain what they mean and their importance for our development typologies. Finally, we make our Importance Verdict.
A score of 5 means no development is possible; these sites are excluded completely. Scores of 0 to 4 mean no to high impact; these sites receive grades from 0 to 4, which are subtracted from a base development potential of 10.
As an example, a site located in the Dolomitic Area will have a development Potential of 10-4=6.
Explore Risks and Constraints in detail ⓘ.
Total of residential sites: 323 994, which is 50% of the total.


The following modes of transport are included in the calculation: Rea Vaya BRT, PRASA passenger rail, Gautrain train and Gautrain bus routes, Metrobus and taxi ranks. For each development opportunity, we searched for transit stops within a 15-minute walk. The more modes of transport are accessible the higher the grade. If there is no public transport stops accessible it means that the place is entirely car-dependent, and development opportunities get a grade of ‘-6’. If all available modes of public transport are available a site gets the highest grade of ‘+6’.
In detail, for every address, the Local Amenities Index identifies how many amenities are available within a 15-minute walk. The location contributes to urban sprawl, getting a negative value if no services are available. The more services are available, the higher the grade is, and the more walkable and mixed-use the neighbourhood is.
We calculated the Local Amenities Index for each 250x250 meter cell of land. From every centre of a cell, we calculated a 15-minute walk area and counted all the commercial, educational, government and healthcare services.
Because services are of various priority, they are split into three groups and assigned distinct weights:
- Necessary - services one needs daily, i.e. shops, pharmacies, schools, and child care. These services are essential for every family and are assigned a weight of 0.5.
- Optional - services one uses when there is spare time (and money) - sports, leisure, going for a walk, eating out. Optional services are assigned a weight of 0.3. These amenities are indicators of a prosperous community.
- Social - services one needs only occasionally: hospitals, post offices, and police stations. These services are pillars of a safe and inclusive community and are assigned a weight of 0.2.
Finally, we calculate Local Amenities Index as 0.5 x of Necessary + 0.3 X Optional + 0.2 X Social for every 15-minute walk area in any given location.

For example,
1) The site is located in the Dolomitic area and received a value of 0-3=3 for Planning Constraints
2) The Site is - at the same time - in the Transformation Zone, which has an Importance Value of 1 for Development Incentives
3) The resulting combined value for planning constraints and development incentives is 0-3+1=-2.
Total of residential sites with the maximum number of incentives: 792
Johannesburg is on the same track - a large part of its planning arsenal aims to create dense nodes and equitable, walkable neighbourhoods. Nodal Review 2019/20 is one of the key and most recent policy pieces for the City of Johannesburg that promotes densification balanced with the provision of amenities and a transport system.
However, Nodal Review 2019/20 is a policy limited by the city boundaries of the City of Johannesburg. It is based on static data and does not include all social infrastructure and services.
For this reason, we developed our own indices: Public Transport Accessibility Index ⓘ and Local Amenities Index ⓘ. These indices demonstrate if development opportunity contributes to urban sprawl or compact and walkable urban structure. These indices are designed to scale nationwide and help property entrepreneurs see the real potential of a location nationwide and how this extra density is balanced with the provisions of transport and services.
Negative values of the indices mean that the new project contributes to urban sprawl, while positive values mean an area will benefit from an extra density.
To get an instant measure for a new project we created Development Impact Gauge (see fig.10) that combines two indices. The values of the gauge range from -6 for the worst impact to +6 for the projects with the best impact on the city and the community.


For example,
1) The site is located in the Dolomitic area and received a value of 10-4=6 for Risks and Constraints.
2) The Site is at the same time in the Transformation Zone, which has an Importance Value of 3.
3) The resulting Development Potential of the site is 10-4+3=9.
We analysed the spatial distribution of listings in Johannesburg by aggregating the prices by Main Places boundaries according to the latest Census. Each area has been categorised based on average rental prices per room within its boundaries. We used a total of 3 price categories: low, medium, and high. Low corresponds to less than R 4000 per month per bedroom, medium is R 4000 - 8000; high is more than R 8000.


in touch
- land use rights
- registration status
- size
All rights reserved


